Water evidence. Crop context. Better questions for the field.
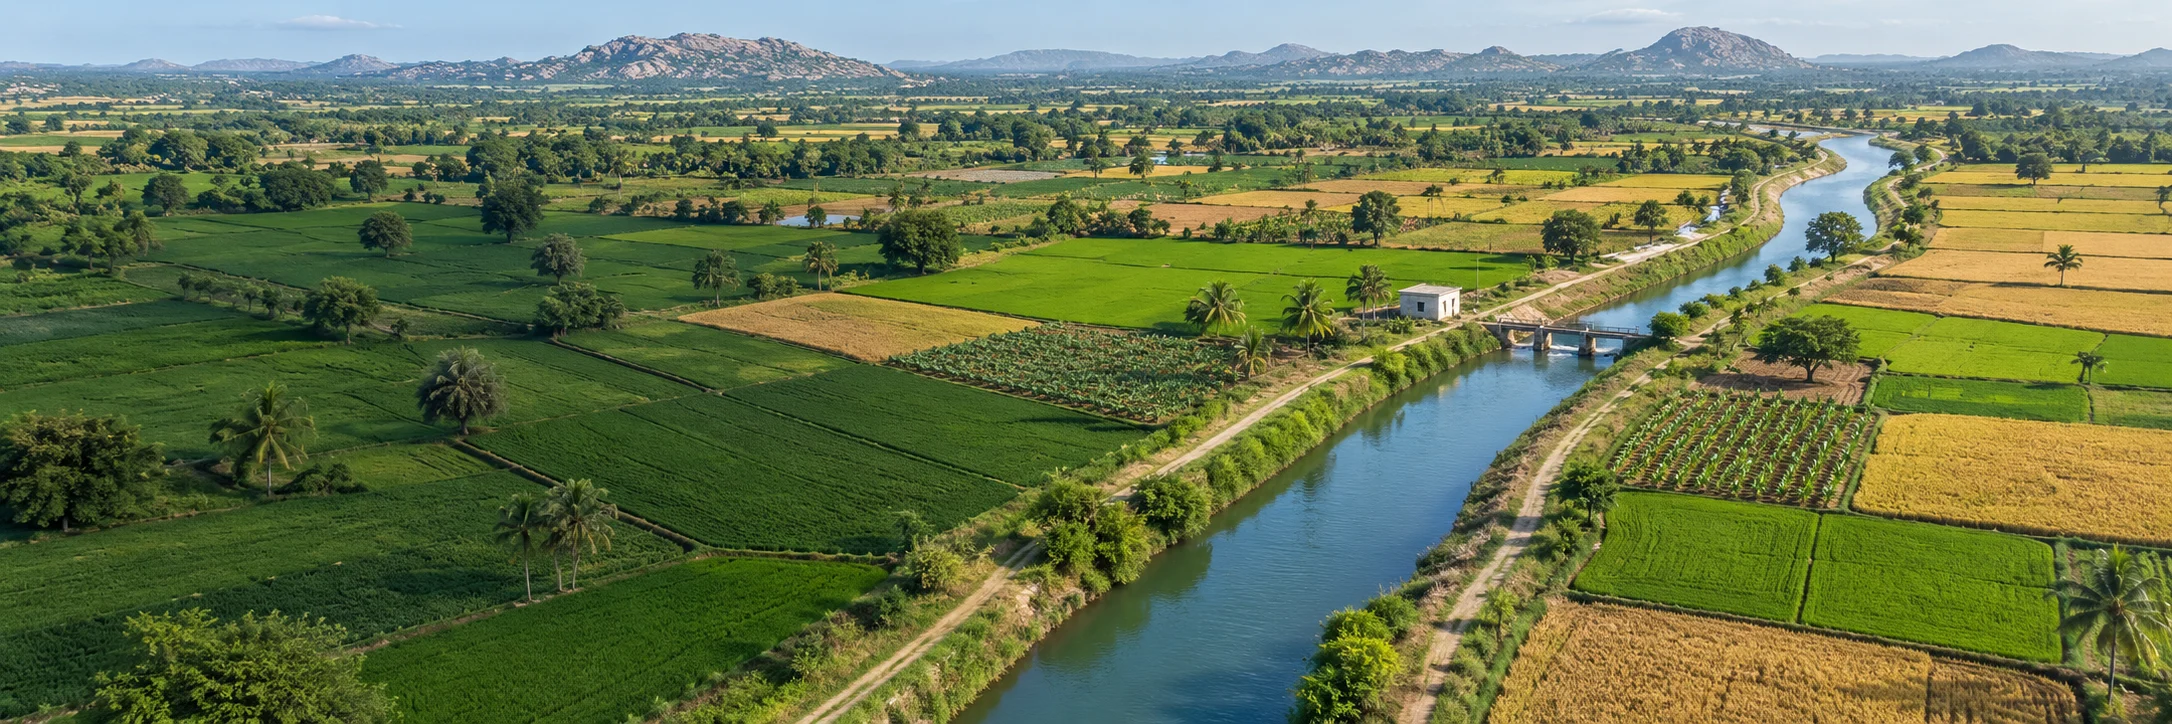
AI landscape illustration
What this is
Which crops are short of water this week, mandal by mandal, and how far that call has held up.
What it says now
Most crops are short of water now in 155 mandals; the check’s record is weak, so read it as where water is needed, not as a forecast.
What to do with it
Aim crop advisories and field checks; work any field through in the crop-water lab.
Prototype planning workspace. Groundwater evidence and illustrative crop scenarios are separate. No field watering instruction or crop-loss prediction.
Where each figure comes from
Gauge rainfall, modelled soil moisture and reservoir storage come from APWRIMS; reference evapotranspiration and rain from ECMWF’s open forecast; crop vegetation from NOAA’s satellite index; the groundwater category from the official assessment on INGRES. Each is dated. Crop booking and canal delivery to fields are not connected.
RESEARCH SNAPSHOTReal source inputs. Not live telemetry.Baseline review pending. Seasonal flags are provisional.Groundwater through Sept 2026Sources, checks and release gates
Seasonal flags are provisional, not operational advisories. 78 source-series flags change with an unfiltered history baseline.
GROUNDWATERAPWRIMS monthly series
Sept 2026 observations. Retained research history; source-use authorization pending.
06-09 / 2026 monthly satellite-and-gauge product, equal-weight mandal means, for the history since 1981. AP DES mandal gauges to 17 Oct 2026: −39.6% against the department's normal, area-weighted.
Modelled soil moisture (NRSC, via APWRIMS) for 18 Oct 2026. Reservoir storage 44.5% of capacity at 19 Oct 2026, measured at the headworks. Not connected: crop, sown area, stage and canal delivery to fields. The crop-water lab uses reference coefficients and user-set assumptions.
Snapshot built 2026-10-19. Groundwater fetch receipt: 2026-10-19. Public portal check 2026-10-19: 3/3 sampled series matched. This does not verify every mandal.
Useful now
Briefings, historical comparison and selecting records for field verification. Groundwater flags are not crop-loss or drought declarations.
Baseline review required
Seasonal comparisons inherit model-history eligibility filters. 580 source-series comparisons change when unfiltered valid history is used. Departmental baseline approval and a versioned data/film refresh are required.
Operational release pending
Authorised feeds, official location IDs, validated thresholds, crop/supply joins, a named approving officer and an auditable action log. No allocation or farmer advisory is issued here.
Seasonal shortfall flags127 / 24%Of compared units · not crop loss
Crop-area exposureNot assessedCrop records not connected
Unresolved / missing147Kept visible, never treated as safe
Three signals agree65 / 520Groundwater, gauge rain and soil all point to stress · of units where all three are usable
01 / District review brief
Where should the next field review begin?
Provisional evidence · approval pending
27 / 127
flagged boundary units are in Nandyal, Anakapalli, NTR.A concentration of groundwater flags, not a ranking of crop damage.
Top 6 by count
Larger shortfallFlaggedNot flaggedUnresolved
Share of boundary units100%
Counts use unique, reconciled boundary units. Bar width is not land area. Unresolved units remain outside the compared denominator.
District / 2026-09
Nandyal
42%flagged / compared10 of 24 units
83%evidence coverage5 unresolved of 29
8three signals agreegroundwater, gauge rain, soil
Examples for flag review
Allagadda · Rudravaram · Jupadu Bungalow
01
Validate the water signal
Groundwater team · baseline and current well readings.
02
Establish crop exposure
Agriculture team · crop, stage, sown area and irrigation source.
03
Check available supply
Water Resources team · delivery windows and usable storage.
Proposed checks only. No owner assigned or action issued. Crop exposure and allocable water remain unknown.
02 / This week in the fields
Which crops will run short of water this week?
Soil 18 Oct · forecast 19 Oct to 25 Oct
124 mandals where maize at the mid-season stage is already short of water, and 63 more within seven days on the forecast.81 of the 124 are mostly rainfed, where a rainfed water balance applies; mostly irrigated mandals are hatched.
Weak record4 km index, rainfed fieldsNot borne outfield scale, Sentinel-2
Re-run on 30 past kharif weeks (2024–26) in the 437 mostly rainfed mandals: in the same mandal and season, vegetation on rainfed fields three weeks after the check called maize at the mid-season stage short of water read 1.5 index points lower than after it called it comfortable (569 mandal-seasons). Real but small, and the same way in every season: read the check as where crops need water now, not as a forecast of what the vegetation will do.
Live scorecardEach week’s calls on the real forecast are frozen as made and scored three weeks later, against Sentinel-2 at field scale and the 4 km index; rabi’s clear skies let the field-scale test read most mandals. 5 weeks frozen since 4 Oct; the first score is due 31 Oct.
Field scale, pooled seasons and how the record was scored
At field scale (Sentinel-2, 160 m, rainfed cropland only), in 367 mandal-seasons with a clear view both weeks: the three-week change in greenness (NDVI) was 0.003 higher after a “short” call than after a “comfortable” one, lower in 1 of 2 seasons.
Pooled across seasons the same mandal reads 11.3 index points lower after “short”, but most of that is drier seasons against wetter ones: the check tells a dry season from a wet one, as rainfall alone would.
Mandals where less than half the cropland was mapped irrigated (ESA WorldCereal, rabi 2020-21), with the vegetation index weighted to rainfed cropland only. Two comparisons were run first and are kept on record. Pooled across mandals the check does not separate vegetation: the places called short most often are the chronically dry ones, VCI compares each place with its own past, and irrigated fields stay green whatever the soil model says. Inside one mandal but pooled across seasons the gap is large, mostly because “short” calls come in the drier seasons. The verdict holds both the place and the season fixed. Weather as it happened (ERA5), not the forecast; vegetation from the satellite index, which the soil model does not use.
Vegetation after “short”, against after “comfortable” Index points, same mandal and season. Dashed: the 5-point bar for “backed”.
2024−2.3104 mandals
2025−0.6161 mandals
2026−1.7304 mandals
Rainfed−1.5569 mandal-seasons
All cropland−1.1weak record
← lower after “short”, as the check expectsagainst it →
Short nowWithin 7 daysComfortableNo valueSevereMostly irrigated
Districts with the most mandals short or nearly short
Maize, mid-season · share of mandals with a soil value
How the check works, and what it is not
An FAO-56 root-zone water balance, mandal by mandal. It starts from the soil moisture APWRIMS publishes for 18 Oct 2026 (NRSC’s VIC model: plant-available water in the top 5, 30, 100 and 150 cm as a share of what the soil holds) and steps the root zone forward one day at a time to 25 Oct 2026: rain counts in full unless it is under a fifth of the day’s reference evapotranspiration (FAO-56 treats that as evaporated), and the crop uses Ks × Kc × ETo. Stress begins when the crop has used the share p of the root zone’s available water that FAO-56 Table 22 gives it, adjusted for this week’s rate of use; below that, its water use falls in proportion (Eq. 84). “Short now” means the crop is below that line today; “severely” means at half its unstressed rate or less.
Inputs. Reference evapotranspiration (FAO-56 Penman-Monteith) and rain: ECMWF IFS open-data forecast, via Open-Meteo (model ecmwf_ifs, CC BY 4.0 (ECMWF open data; Open-Meteo)), at a point inside each mandal; days before today are the model’s recent runs, not station readings. How much water the soil holds: ISRIC SoilGrids 2.0 (field capacity minus wilting point, by depth; predicted from soil profiles, CC BY 4.0). Crop coefficient, root depth and p: FAO-56 Table 12 and Table 22, the larger root depth that footnote gives for rainfed crops, capped at 1.5 m (the deepest the soil model reports); 0.2 m at the initial stage. Chilli and red gram use the nearest FAO-56 rows, as in the lab.
What it is not. The crop and stage are chosen here, not observed: crop-sown records are not connected, so a mandal is checked whether or not the crop grows there. No irrigation, runoff from heavy rain or capillary rise is modelled; mandals where half or more of the cropland was mapped irrigated in rabi 2020–21 (ESA WorldCereal, 10 m, CC BY 4.0) are hatched, since the balance speaks for their rainfed fields only. It is a screening view for where to look, not a watering instruction, a crop-loss estimate or a drought declaration. The counts on this page are reproduced independently by the pipeline's own copy of the calculation.
03 / The field water budget
A crop's needs change with its stage.
Illustrative scenario · 7 days
THE CROP / 02MaizeMid-season
The usable root-zone reserve buffers a rain gap. It is a scenario input, not groundwater depth or satellite soil-moisture percentile.
Growth stage / reference comparisonSame inputs · 7-day crop ET
Uncovered crop ET11.6 mm / 7 days
Rain 8.0Reserve 14.0Gap 11.6 mm
Scenario inputs
Selected reference stageMid-season
1.20Kc
Crop ET = reference ET × Kc × 74.0 × 1.20 × 7 = 33.6 mm0.0 mm reserve not used · 0.0 mm rain not allocated
SCENARIO COVERAGE65%
Of estimated crop ET covered by effective rain and the assumed usable soil reserve.
Not crop health, yield or irrigation advice.
Scenario assumptions and reference
The section is drawn to scale for soil depth (0–2.3 m). Root depths are FAO-56 Table 22 ranges for the crop (about 0.15–0.20 m at sowing); plant heights follow FAO-56 Table 12, drawn at half scale. Each crop is drawn by its habit, with fibrous roots for the cereals and a taproot for the others; flowers, pods and bolls are enlarged to be legible. Rain streaks, seepage marks and rising vapour are drawn in proportion to the inputs, not simulated. Soil layers are generic, not a surveyed profile. The water table is the State network’s latest statewide average, for scale only. No irrigation or capillary rise is included. All effective rain and usable reserve are assumed available within the seven-day window; timing and soil capacity are not simulated. Rain not allocated to crop ET is not an estimate of groundwater recharge. A zero gap is not proof of a healthy crop. This is not a watering schedule, drought forecast or crop recommendation.
Grain maize; end coefficient assumes field-dried grain. Crop varieties, wetting frequency, local climate and field conditions require agronomic calibration. Paddy is not represented because flooding and percolation require additional accounting. Sources: FAO-56, Chapter 6, Table 12 (coefficients, heights) and Chapter 8, Table 22 (rooting depths).
04 / Observed water evidence
Where does the water story need a closer look?
Groundwater readings · Sep 2026
Gauge rainfallMeasured−39.6%against normal
1 Jun 2026 to 17 Oct 2026 · 3,532 gauges · area-weighted
Scanty 89
Deficient 514
Normal 84
Excess 1
603 of 688 mandals deficient or scanty
Satellite estimate (CHIRPS v3.0), Jun to Sep: 473 mm against 599 mm (−21.1%), the 6th driest of 46 years. Gauges are the measurement; the satellite record supplies the history since 1981.
86 at their driest for the date since 2014 · median mandal 48.9% of capacity
NRSC VIC land-surface model, as published on APWRIMS for 18 Oct 2026. Plant-available water as a share of what the soil holds: modelled, not measured in a field.
114 major and medium reservoirs, 517 of 1161 TMC, latest reading 19 Oct 2026, 18:38 IST. Bar: now; tick: a year ago. 3 had not reported for 3 days or more.
Largest canal releases now
Nagarjuna Sagar LMC6,634 cusecs
Sir Aurthur Cotton Barrage Western Delta5,500 cusecs
Prakasam Barrage KE MAIN DOWNSTREAM2,823 cusecs
Sir Aurthur Cotton Barrage Eastern Delta2,500 cusecs
Prakasam Barrage KW Main Downstream2,423 cusecs
Srisailam R MGK LIS2,400 cusecs
Measured where water leaves the reservoir. Which mandals a canal reaches, and how much arrives, needs the canal command-area map, which is not public.
Crop vegetationSatellite index243of 670 mandals severely below normal · 17 Sep to 14 Oct
278 moderately below · 149 normal · median index 46.5
25 JunSeverely below normal: 123 → 289 mandals8 Oct
Severe (0–40)
Moderate (40–60)
Normal (60–100)
Vegetation Condition Index: this week’s greenness against the same week in every year on record (0 the worst seen, 100 the best), NOAA STAR, 4 km. Weighted to cropland with ESA WorldCover 2021, so forest does not stand in for fields. Classes per the drought manual, Table 3.4. A satellite index of plant vigour, not crop yield or sown area.
NOAA STAR Vegetation Health Groundwater assessment 2025-2026Official32.4%of the State’s annual extractable groundwater is drawn each year · 31.5% in 2024-2025
Over-exploited 14
Critical 6
Semi-critical 28
Safe 599
Saline 41
48 of 688 assessment units semi-critical or worse, against 31 in 2024-2025 · 26 mandals moved to a worse category, 16 to a better one
8,892 million m³ drawn a year, 87% for irrigation, of 30,242 million m³ extractable
The Dynamic Ground Water Resources assessment, made each year by CGWB and the State Ground Water Department under the GEC-2015 method; in Andhra Pradesh the assessment unit is the mandal. Safe up to 70% drawn, semi-critical 70–90%, critical 90–100%, over-exploited above 100%; saline where the water is too salty to use. 664 of our 670 boundaries are matched to their unit; city wards that INGRES assesses separately are left unmatched.
Context only: rainfall, soil moisture, storage, the vegetation index and the assessment do not change the groundwater flags below, and none of them is the crop-water lab’s effective rain. Colour the map by any of the three views.
One cell or polygon per mandal boundary. Colour represents groundwater change, not planted area, crop health or yield. District counts use all compared units in that district.
Coverage, flags and interpretation
523 uniquely linked boundary units are compared. 40 boundaries have ambiguous series or identities; 40 seasonal source series have no usable boundary index and are not mapped or counted as extra land. Other unresolved boundaries lack matching evidence or sufficient history. Counts therefore differ from the source-series totals on Monsoon Watch.
Flags reuse the existing seasonal rule: a shortfall of at least 1 m AND at least twice the mandal's historical spread (spread floored at 0.30 m). Flagged shortfalls of at least 2 m are labelled larger shortfalls. A positive shortfall means deeper water than the historical seasonal change would imply. Changes are not attributed to El Niño, and are not direct recharge volumes. Baseline: previous ten years, at least seven comparable seasons. Official boundaries and source authorization remain pending.
Field review list
Groundwater flags first, then how many sources agree · no crop-loss ranking
1/2 Marks, in order: groundwater, gauge rain, soil. Filled: points to stress. Open: does not. Dashed: no usable value. Tests: shortfall flagged; rain 20% or more below normal; soil among the driest quarter of years for the date (modelled, and driven by rainfall).
Mandal / district
Water signal
Shortfall vs normal
Signals pointing to stress
Crop evidence
Next verification
Larger shortfall
25.00 m
3/3
Not connected
Confirm well, crop stage and supply
Larger shortfall
20.52 m
3/3
Not connected
Confirm well, crop stage and supply
Larger shortfall
19.14 m
3/3
Not connected
Confirm well, crop stage and supply
Larger shortfall
17.82 m
3/3
Not connected
Confirm well, crop stage and supply
Larger shortfall
16.98 m
3/3
Not connected
Confirm well, crop stage and supply
Larger shortfall
11.27 m
3/3
Not connected
Confirm well, crop stage and supply
Larger shortfall
11.23 m
3/3
Not connected
Confirm well, crop stage and supply
Larger shortfall
9.89 m
3/3
Not connected
Confirm well, crop stage and supply
Larger shortfall
9.18 m
3/3
Not connected
Confirm well, crop stage and supply
Larger shortfall
9.06 m
3/3
Not connected
Confirm well, crop stage and supply
1-10 of 670
Page 1 / 67
05 / From evidence to an advisory
The missing links matter.
Operational release pending
01
Water evidence
Dated inputs available
Groundwater source histories, CHIRPS v3.0 rainfall since 1981 and AP gauge rainfall. Research authorization and official boundary validation pending.
Season, crop, sown area, sowing date and irrigation source. APWRIMS already holds crop-sown and crop-stress dashboards behind a login: the ask is read access to mandal-by-crop aggregates from e-Panta / APAIMS, not farmer records.
Public view: no farmer identities or personal parcel records. No crop-loss, income-loss or safe-pumping claims. Illustrations are not evidence of actual field conditions.