Monsoon Watch — El Niño
- What this is
- Whether this monsoon recharged the ground: each mandal's groundwater against its own past seasons, with El Niño beside it.
- What it says now
- Jun–Sep 2026 rain was 21.1% below normal; 54.3% of mandal series sit lower than in May.
- What to do with it
- See where recharge failed this season, and so where the summer starts short.
RESEARCH SNAPSHOTReal source inputs. Not live telemetry.Baseline review pending. Seasonal flags are provisional.Groundwater through Sept 2026Sources, checks and release gates
Seasonal flags are provisional, not operational advisories. 78 source-series flags change with an unfiltered history baseline.
Sept 2026 observations. Retained research history; source-use authorization pending.
APWRIMS source06-09 / 2026 monthly satellite-and-gauge product, equal-weight mandal means, for the history since 1981. AP DES mandal gauges to 17 Oct 2026: −39.6% against the department's normal, area-weighted.
Publisher catalogueJAS 2026: 2.16 °C. Three-month index, not a mandal forecast. Film and ocean maps have separate snapshot dates.
Current NOAA advisoryModelled soil moisture (NRSC, via APWRIMS) for 18 Oct 2026. Reservoir storage 44.5% of capacity at 19 Oct 2026, measured at the headworks. Not connected: crop, sown area, stage and canal delivery to fields. The crop-water lab uses reference coefficients and user-set assumptions.
NIC e-Panta contextSnapshot built 2026-10-19. Groundwater fetch receipt: 2026-10-19. Public portal check 2026-10-19: 3/3 sampled series matched. This does not verify every mandal.
Briefings, historical comparison and selecting records for field verification. Groundwater flags are not crop-loss or drought declarations.
Seasonal comparisons inherit model-history eligibility filters. 580 source-series comparisons change when unfiltered valid history is used. Departmental baseline approval and a versioned data/film refresh are required.
Authorised feeds, official location IDs, validated thresholds, crop/supply joins, a named approving officer and an auditable action log. No allocation or farmer advisory is issued here.
All season figures141 provisional shortfall flagsBaseline, flags, storage estimate and gauges, with how each is measured
May-to-2026-09 change against the same mandal's median over the previous 10 years; flagged short at >= 1.0 m AND >= 2.0x its own year-to-year spread. Source-series totals are not unique boundary counts; the Agriculture review uses reconciled boundary units. Baseline review pending.
of the rain that fell on Andhra Pradesh this season is still in the ground.
A mandal cannot bank more rain than fell on it. Where it appears to, the water came from somewhere else — canal seepage and irrigation return flow, which the official method counts as its own recharge component and which no released dataset measures. That those 1 mandals are all in the delta is the method behaving as it should.
Water-table fluctuation (GEC-2015): the May-to-latest rise times the mandal's specific yield times its area. Net of the season's own pumping, which no public source observes, so gross recharge is larger. Shares are left out below 100 mm of season rain, where the ratio is governed by its denominator rather than by recharge; 5 mandals fall under that floor and keep their volume without a share.
is where the median mandal stands against its own May, and no season since 2016 has been on this side of zero in September. The official assessment closes its window in November.
What the last stretch has done: in 5 of 8 closed seasons the table rose further between September and November; in 3 it fell back. The range is -1.35 m to +0.74 m, so November has gone both ways and nothing here is projected into it.
Median change from the same mandals’ own May reading, on one fixed set of mandals a season, so the lines can be read against each other. The Dynamic Ground Water Resources assessment compares pre-monsoon with post-monsoon; this window closes when the November readings arrive.
From the Pacific to Andhra Pradesh
Transcript and sources
0:00 · A connected planet
Andhra Pradesh's monsoon has a distant connection: the Pacific Ocean.
0:06 · The Pacific engine
Normally, trade winds push warm surface water towards Indonesia. Cold water rises near South America.
0:15 · El Niño / When the pattern shifts
During El Nino, trade winds weaken. Warmth spreads east and tropical rainfall shifts.
0:22 · A pattern with a history
Major events: nineteen ninety seven; twenty fifteen.
0:27 · The ocean now / observed and forecast
NOAA's July to September ocean index is plus 2.16 degrees. Its October eighth outlook projects a relative-index peak of 2.74 degrees. Strong to very strong conditions remain over eighty three percent likely through March. This is not an Andhra Pradesh rainfall forecast.
0:48 · The India connection
India's summer monsoon can weaken. The Indian Ocean and local weather also matter.
0:55 · Andhra Pradesh / 45 years of rain
5 of 7 El Nino summer monsoons were below average in Andhra Pradesh, averaging 13 percent below.
1:04 · Andhra Pradesh / rainfall
June to August 2026 rainfall was 41.5 percent below average. Rank 1 driest in 46 years.
1:16 · October-December / northeast monsoon
Historically, El Nino northeast monsoons averaged 7.7 percent below normal: 9 of 15 years. The north coast fared worst. This season has only just begun.
1:29 · From rain to groundwater
Rain infiltrates soil and fractured rock. Pumping and geology shape what remains.
1:36 · Andhra Pradesh / well readings
By September, 54.3 percent of compared mandals were deeper than in May. 85.7 percent were short of their own ten year normal.
1:47 · Districts / change against own history
District shortfalls differ. These are medians of observations, not predictions.
1:54 · The State's own wells / measured snapshot
The State's 1746 station network reads 11.43 metres below ground on September ninth, 3.18 metres deeper than a year earlier.
2:07 · A closer look / Orvakal
Orvakal reads 29.68 metres. Water is 14.61 metres deeper this season, instead of its usual 2.36 metre rise.
2:19 · Possible outcomes / conditional
Less recharge and continued pumping can increase pressure on wells.
2:25 · May 2027 / projection from past winters
Past winters project 126 mandals beyond their deepest May. 76 are already over ten metres deep, home to about sixty seven lakh people in twenty twenty. Historically, only 32.5 percent of beyond-record calls materialised.
2:43 · Drought manual / evidence as of 2026-10-10
As of October tenth, 477 mandals meet the rainfall trigger. 30 read severe, 325 moderate. This is manual evidence, not a drought declaration.
2:57 · Preparedness / homes, farms and communities
For a possible dry spell: protect drinking water. Use drip irrigation and mulch where suitable. Agree a village contingency plan with local teams.
3:09 · Cities / reduce the impact
Cities cannot stop El Nino. Fix leaks, protect lakes, reuse safely treated water for non-drinking needs.
3:18 · A proposed state review
Keep observations, NOAA's forecast and summer projections separate. None forecasts Andhra Pradesh rainfall. Verify locally. Assign action.
- NOAA: ENSO and the Indian monsoon
- NASA Blue Marble
- NOAA: major historical El Nino events
- NOAA ERSST v5
- CHIRPS
- NOAA CPC: Pacific outlook (RONI)
- NOAA CPC: observed ONI
- State groundwater network
- Summer projection and track record
- Drought Manual 2020
- NIDM: drought preparedness and water conservation
- NIDM: drought management and drinking-water contingency plans
- ICAR: water-smart irrigation and mulching
- Jal Shakti: Catch the Rain
- MoHUA: AMRUT 2.0 urban water security
- Project snapshot and methodology
The El Niño ahead, and what past ones meant here
“El Niño continues to strengthen, with a strong-to-very strong El Niño likely through January-March 2027 (remaining greater than an 83% chance).”NOAA CPC ENSO Diagnostic Discussion, 8 Oct 2026
Median peak +2.74 °C in Oct–Dec 2026; half of NOAA’s outcomes lie between 2.54 and 2.94 °C. Dark band: 25th–75th percentile; light: 5th–95th.
Show the numbers
| Season | Median | Middle half (25th–75th) | Range (5th–95th) |
|---|---|---|---|
| Sep–Nov 2026 | +2.47 | +2.35 to +2.59 | +2.18 to +2.76 |
| Oct–Dec 2026 | +2.74 | +2.54 to +2.94 | +2.25 to +3.23 |
| Nov–Jan 2027 | +2.65 | +2.39 to +2.92 | +2.00 to +3.31 |
| Dec–Feb 2027 | +2.36 | +2.04 to +2.68 | +1.58 to +3.14 |
| Jan–Mar 2027 | +1.90 | +1.59 to +2.22 | +1.13 to +2.67 |
| Feb–Apr 2027 | +1.33 | +1.05 to +1.60 | +0.66 to +2.00 |
| Mar–May 2027 | +0.83 | +0.58 to +1.08 | +0.23 to +1.43 |
| Apr–Jun 2027 | +0.40 | +0.14 to +0.66 | −0.22 to +1.02 |
| May–Jul 2027 | +0.03 | −0.26 to +0.32 | −0.68 to +0.74 |
- Very strong (≥ 2.0 °C)
- Strong (1.5–2.0)
- Moderate (1.0–1.5)
- Weak (0.5–1.0)
- Neutral
- La Niña
A very strong event (≥ 2.0 °C) peaks at 100%. Top figure on each bar is that chance.
Show the numbers
| Season | Very strong | Strong | Moderate | Weak | Neutral | La Niña |
|---|---|---|---|---|---|---|
| Sep–Nov 2026 | 100% | 0% | 0% | 0% | 0% | 0% |
| Oct–Dec 2026 | 100% | 0% | 0% | 0% | 0% | 0% |
| Nov–Jan 2027 | 96% | 4% | 0% | 0% | 0% | 0% |
| Dec–Feb 2027 | 81% | 16% | 3% | 0% | 0% | 0% |
| Jan–Mar 2027 | 46% | 37% | 15% | 2% | 0% | 0% |
| Feb–Apr 2027 | 6% | 32% | 44% | 16% | 2% | 0% |
| Mar–May 2027 | 0% | 5% | 32% | 48% | 15% | 0% |
| Apr–Jun 2027 | 0% | 0% | 7% | 38% | 54% | 1% |
| May–Jul 2027 | 0% | 0% | 2% | 15% | 70% | 13% |
An El Niño forecast is a forecast for the tropical Pacific, not a rainfall forecast for Andhra Pradesh. What the state’s own record shows:
Statewide October–December, average of 15 El Niño years. Below normal in 9 of 15, against 23 of 45 years overall.
June–September after the 15 El Niño winters. Below normal in 4 of 15, against 21 of 45 years overall.
- 1983+18.9%after 1982–83, +2.0 °C
- 1998+17.4%after 1997–98, +2.3 °C
- 2016+0.4%after 2015–16, +2.5 °C
In all 3, the next monsoon was at or above normal. 3 cases are too few to promise anything.
- Sri Potti Sriramulu Nellore55%−3.2%8/15 below
- Tirupati51%−5.7%9/15 below
- Prakasam41%−1.6%9/15 below
- Chittoor39%−10.6%11/15 below
- Annamayya36%−12.7%9/15 below
- Markapuram34%−4.0%9/15 below
- Bapatla33%+0.4%8/15 below
- Kurnool−97%2.6 / 88.7 mm
- Nandyal−96%4.1 / 97.4 mm
- Palnadu−94%5.6 / 88.2 mm
- Krishna−92%10.7 / 131.8 mm
- NTR−91%9.8 / 113.7 mm
Forecast: NOAA CPC official ENSO outlook, strength probabilities and diagnostic discussion; RONI: CPC's relative Niño 3.4 index, three-month means, 1991–2020 base. Fetched 19 Oct 2026, weekly. Record: CHIRPS v3 monthly rain, equal-weight mandal means; El Niño years by NOAA’s ONI. Neither enters any model on this site.
El Niño is a recurring warming of the central and eastern equatorial Pacific, coupled with changes in atmospheric circulation. The film explains the mechanism; this record shows how ocean temperature anomalies evolved. Rainfall over India also depends on the Indian Ocean and local weather.
Pacific heat, month by month
Sept 2026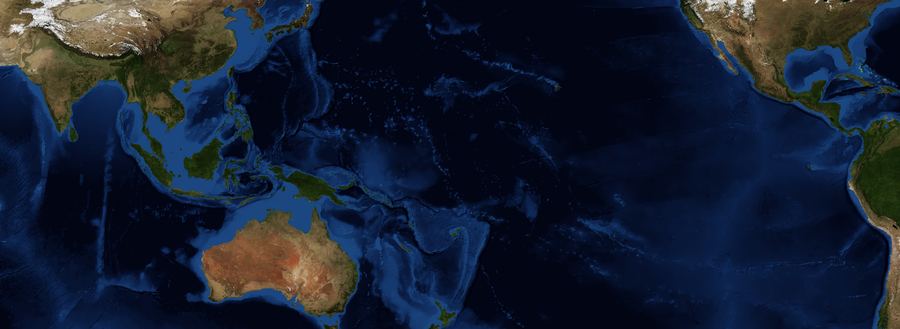

















 Andhra PradeshIndonesiaSouth AmericaPACIFIC OCEAN
Colours show reconstructed ocean temperatures, not wind measurements or water flowing to India. Monthly Niño 3.4 values alone do not establish an ENSO event. AP mandal outlines are official where rebuilt from the State's points, prototype elsewhere.
Source and index notes
NOAA Extended Reconstructed SST v5; anomaly against 1991-2020. Earth imagery: NASA Blue Marble Next Generation (public domain). The figure beside each month is that single month’s average anomaly in the Niño 3.4 box. The published index — the +2.16 °C quoted above— is a three-month running mean of the same box, so it lags a fast-rising month and reads lower. Computed here against a 1991–2020 baseline, the running mean lands within about 0.2 °C of NOAA’s published value throughout this event.
A band of the equatorial Pacific runs warm. The index describes the JAS 2026 ocean state; local rainfall outcomes also depend on other climate and weather influences.
NOAA Oceanic Niño IndexCHIRPS analysis across 45 years: below normal in 6 of 8 warm-index years, against 21 of 45 overall. These are historical associations, not independent causal events.
CHIRPS 1981–2025473 mm fell against a 599 mm normal for the same months. This observed deficit is not an attribution to El Niño.
CHIRPS, 1981 onwardDerived from monthly source-series depth changes. The baseline inherits model-history eligibility filters; hydrological review is pending. This is not measured recharge or a crop-loss forecast.
APWRIMS monthly readingsThe ocean index, gridded rainfall estimates and groundwater source readings are different kinds of evidence. The ocean-rain link is a historical statistical association, not a mechanism this site models or a forecast for an individual district. Groundwater movement also reflects pumping and local conditions.
These are changes in each mandal’s groundwater readings since May, compared with its own historical change by Sep. Rainfall, pumping, geology and other local factors can contribute; this map does not attribute individual changes to El Niño.
Depth change is not measured recharge or water lost. The volume view is an illustrative storage proxy using prototype area and specific yield, which may be interpolated or assigned from an aquifer proxy. It is not an extraction entitlement or an allocation estimate. Multiple series mapped to one boundary are left unresolved, not silently selected or added.
10 flagged source series are not on this map: they never reconciled to a boundary polygon, so there is nothing to shade. They are in the table below and in the export. A map that quietly omitted them would be worse than one that says so.
Show the numbers
| Month | 2026 | Median | Lowest | Highest |
|---|---|---|---|---|
| May | 0.00 m | 0.00 m | 0.00 m | 0.00 m |
| Jun | +0.01 m | +0.11 m | −0.25 m | +0.50 m |
| Jul | −0.23 m | +0.39 m | −0.02 m | +1.09 m |
| Aug | −0.43 m | +0.88 m | +0.36 m | +1.43 m |
| Sep | −0.17 m | +2.02 m | +0.65 m | +2.39 m |
| Oct | — | +2.30 m | +0.54 m | +4.01 m |
| Nov | — | +2.85 m | +0.24 m | +3.48 m |
| Dec | — | +2.28 m | +0.55 m | +3.55 m |
Plotted as change from May, with a historical range from the retained comparison seasons. A rise or fall in water level alone does not isolate recharge from pumping, geology or changes in monitoring.
Right-hand column is the Oceanic Niño Index for that June–August. It is shown for context and is not an input to the groundwater-depth comparisons. It is used to group years in the historical rainfall analysis below.
Show the numbers
| Season | Index |
|---|---|
| JAS 2026 | +2.16 °C |
| JJA 2026 | +1.80 °C |
| MJJ 2026 | +1.39 °C |
| AMJ 2026 | +0.95 °C |
| MAM 2026 | +0.46 °C |
| FMA 2026 | +0.11 °C |
| JFM 2026 | −0.21 °C |
| DJF 2026 | −0.39 °C |
| NDJ 2025 | −0.60 °C |
| OND 2025 | −0.61 °C |
| SON 2025 | −0.57 °C |
| ASO 2025 | −0.43 °C |
| JAS 2025 | −0.26 °C |
| JJA 2025 | −0.11 °C |
| MJJ 2025 | −0.02 °C |
| AMJ 2025 | −0.04 °C |
| MAM 2025 | +0.02 °C |
| FMA 2025 | −0.08 °C |
| JFM 2025 | −0.22 °C |
| DJF 2025 | −0.46 °C |
| NDJ 2024 | −0.43 °C |
| OND 2024 | −0.29 °C |
| SON 2024 | −0.19 °C |
| ASO 2024 | −0.12 °C |
Oceanic Nino Index (NOAA CPC, ERSST v6). The traditional ONI episode criterion uses at least five overlapping seasons at or above +0.5 °C (warm) or at or below −0.5 °C (cool). Current conditions and official declarations also consider atmospheric evidence; this index is not a local forecast.
Show the numbers
| Year | Rain (mm) | Against the mean | Ocean state |
|---|---|---|---|
| 2026 | 473 | -20.7% | El Niño |
| 2025 | 498 | -16.5% | neutral |
| 2024 | 673 | +12.9% | neutral |
| 2023 | 527 | -11.6% | El Niño |
| 2022 | 647 | +8.4% | La Niña |
| 2021 | 655 | +9.9% | neutral |
| 2020 | 757 | +27% | neutral |
| 2019 | 584 | -2.1% | neutral |
| 2018 | 608 | +1.9% | neutral |
| 2017 | 663 | +11.2% | neutral |
| 2016 | 602 | +0.9% | neutral |
| 2015 | 630 | +5.7% | El Niño |
| 2014 | 536 | -10.2% | neutral |
| 2013 | 646 | +8.3% | neutral |
| 2012 | 619 | +3.8% | neutral |
| 2011 | 474 | -20.6% | neutral |
| 2010 | 788 | +32.1% | La Niña |
| 2009 | 469 | -21.5% | El Niño |
| 2008 | 603 | +1% | neutral |
| 2007 | 828 | +38.7% | neutral |
| 2006 | 601 | +0.7% | neutral |
| 2005 | 651 | +9.1% | neutral |
| 2004 | 519 | -13% | neutral |
| 2003 | 502 | -15.8% | neutral |
| 2002 | 384 | -35.7% | El Niño |
| 2001 | 541 | -9.2% | neutral |
| 2000 | 698 | +17.1% | neutral |
| 1999 | 471 | -21.1% | La Niña |
| 1998 | 703 | +17.9% | La Niña |
| 1997 | 590 | -1.1% | El Niño |
| 1996 | 676 | +13.4% | neutral |
| 1995 | 675 | +13.1% | neutral |
| 1994 | 593 | -0.6% | neutral |
| 1993 | 508 | -14.9% | neutral |
| 1992 | 559 | -6.2% | neutral |
| 1991 | 623 | +4.4% | El Niño |
| 1990 | 514 | -13.8% | neutral |
| 1989 | 726 | +21.7% | neutral |
| 1988 | 844 | +41.5% | La Niña |
| 1987 | 419 | -29.7% | El Niño |
| 1986 | 521 | -12.7% | neutral |
| 1985 | 580 | -2.8% | neutral |
| 1984 | 456 | -23.6% | neutral |
| 1983 | 713 | +19.5% | neutral |
| 1982 | 475 | -20.3% | El Niño |
| 1981 | 618 | +3.5% | neutral |
Historical composites use years whose JJA (summer) or OND (winter) ONI is at least +0.5 °C, not a count of independent confirmed events. Small samples and other climate influences limit interpretation. These averages are neither a local forecast nor evidence that El Niño caused a particular loss.
Adding the Oceanic Niño Index to the three-month forecast was tested on rolling origin and made it worse — 1.776 m to 1.850 m mean error, and worse in every aquifer. Two El Niño events inside the training record are not enough to learn a response from, so the model does not use it. Groundwater changes come from the readings and rainfall estimates from CHIRPS. ONI is used to group historical rainfall years for comparison, not to forecast local outcomes.
Two gridded historical temperature products provide climate context. Their trends and warm-index composites differ; neither is a field temperature measurement, attribution of a local heat event, or a forecast of crop water demand.
Show the numbers
| Year | GHCN_CAMS | NOAAGlobalTemp |
|---|---|---|
| 2025 | +1.07 | +0.56 |
| 2024 | +1.91 | +0.90 |
| 2023 | +1.61 | +0.66 |
| 2022 | +0.99 | +0.46 |
| 2021 | +1.04 | +0.45 |
| 2020 | +1.17 | +0.57 |
| 2019 | +1.56 | +0.77 |
| 2018 | +1.24 | +0.53 |
| 2017 | +1.48 | +0.71 |
| 2016 | +1.47 | +0.80 |
| 2015 | +1.31 | +0.67 |
| 2014 | +1.04 | +0.35 |
| 2013 | +0.83 | +0.34 |
| 2012 | +1.12 | +0.53 |
| 2011 | +0.71 | +0.26 |
| 2010 | +1.08 | +0.54 |
| 2009 | +1.24 | +0.63 |
| 2008 | +0.67 | +0.21 |
| 2007 | +0.71 | +0.27 |
| 2006 | +0.81 | +0.30 |
| 2005 | +0.91 | +0.35 |
| 2004 | +0.58 | +0.18 |
| 2003 | +1.23 | +0.62 |
| 2002 | +1.18 | +0.50 |
| 2001 | +1.02 | +0.37 |
| 2000 | +0.60 | +0.10 |
| 1999 | +0.68 | +0.09 |
| 1998 | +1.26 | +0.60 |
| 1997 | +0.97 | +0.28 |
| 1996 | +0.73 | +0.07 |
| 1995 | +0.69 | +0.15 |
| 1994 | +0.63 | -0.08 |
| 1993 | +0.73 | +0.07 |
| 1992 | +0.60 | +0.01 |
| 1991 | +0.68 | +0.10 |
| 1990 | +0.44 | -0.10 |
| 1989 | +0.42 | -0.09 |
| 1988 | +0.68 | +0.28 |
| 1987 | +0.85 | +0.33 |
| 1986 | +0.71 | +0.25 |
| 1985 | +0.69 | +0.09 |
| 1984 | +0.56 | +0.00 |
| 1983 | +0.75 | +0.19 |
| 1982 | +0.86 | +0.11 |
| 1981 | +0.53 | -0.07 |
| 1980 | +0.03 | +0.21 |
| 1979 | +0.16 | +0.21 |
| 1978 | -0.23 | -0.18 |
| 1977 | -0.16 | +0.03 |
| 1976 | -0.57 | -0.08 |
| 1975 | -0.68 | -0.32 |
| 1974 | -0.49 | -0.18 |
| 1973 | -0.04 | +0.22 |
| 1972 | -0.15 | +0.19 |
| 1971 | -0.89 | -0.36 |
| 1970 | -0.42 | -0.05 |
| 1969 | -0.04 | +0.20 |
| 1968 | -0.31 | -0.10 |
| 1967 | -0.49 | -0.10 |
| 1966 | -0.02 | +0.25 |
| 1965 | -0.21 | -0.05 |
| 1964 | -0.24 | +0.01 |
| 1963 | -0.55 | -0.26 |
| 1962 | -0.76 | -0.39 |
| 1961 | -0.43 | -0.24 |
| 1960 | -0.33 | +0.14 |
| 1959 | -0.32 | +0.10 |
| 1958 | 0.00 | +0.10 |
| 1957 | -0.41 | -0.03 |
| 1956 | -0.74 | -0.44 |
| 1955 | -0.72 | -0.31 |
| 1954 | -0.46 | -0.08 |
| 1953 | -0.22 | +0.09 |
| 1952 | -0.32 | +0.10 |
| 1951 | -0.49 | -0.07 |
| 1950 | -0.63 | -0.20 |
| 1949 | -0.63 | -0.26 |
| 1948 | -0.19 | +0.10 |
Sources: GHCN_CAMS (0.5°, land, station and reanalysis blend); NOAAGlobalTemp (5°, station-based anomaly). Sampled by how much of each grid cell falls inside the state, weighted by latitude. No rate is published as a single figure and nothing here is projected forward — this site carries no climate model, and the same rule keeps the ocean index out of the groundwater forecast.
| District | Source series | This season | Typical | Shortfall | Flagged |
|---|---|---|---|---|---|
| Markapuram | 19 | +2.47 m | -1.75 m | +5.68 m | 5 |
| Annamayya | 16 | +3.47 m | -1.67 m | +5.31 m | 4 |
| Nandyal | 27 | +1.62 m | -2.12 m | +4.64 m | 12 |
| Eluru | 24 | +0.3 m | -3.18 m | +3.99 m | 8 |
| Y.S.R Kadapa | 33 | +1.85 m | -1.82 m | +3.76 m | 6 |
| Chittoor | 21 | +2 m | -1.43 m | +3.57 m | 4 |
| Sri Sathya Sai | 29 | +1.74 m | -0.55 m | +3.06 m | 5 |
| Polavaram | 7 | -0.07 m | -3.24 m | +2.91 m | 4 |
| Anakapalli | 20 | +0.08 m | -2.82 m | +2.83 m | 10 |
| Ananthapuramu | 31 | +1.2 m | -0.76 m | +2.65 m | 6 |
| NTR | 18 | -0.61 m | -2.69 m | +2.25 m | 8 |
| Palnadu | 28 | +0.04 m | -2.75 m | +2.23 m | 9 |
| Alluri Sitharama Raju | 10 | -1.72 m | -3.49 m | +1.99 m | 3 |
| Prakasam | 23 | +1.61 m | -0.55 m | +1.91 m | 7 |
| Kurnool | 22 | +0.61 m | -1.11 m | +1.61 m | 5 |
| East Godavari | 18 | -0.62 m | -2.11 m | +1.43 m | 6 |
| Visakhapatnam | 9 | -1.12 m | -2.73 m | +1.31 m | 1 |
| Guntur | 15 | -0.42 m | -2.24 m | +1.29 m | 5 |
| Krishna | 22 | -0.15 m | -1.22 m | +1.23 m | 9 |
| Kakinada | 16 | -0.25 m | -2.43 m | +1.17 m | 3 |
| Tirupati | 30 | +0.7 m | -0 m | +1.11 m | 1 |
| Sri Potti Sriramulu Nellore | 30 | +1.1 m | +0.32 m | +0.93 m | 3 |
| Bapatla | 17 | -0.25 m | -1.11 m | +0.73 m | 3 |
| Srikakulam | 24 | -2.19 m | -3.28 m | +0.7 m | 7 |
| Parvathipuram Manyam | 15 | -2.98 m | -3.25 m | +0.69 m | 4 |
| Konaseema | 16 | -1.22 m | -1.26 m | +0.19 m | 1 |
| Vizianagaram | 23 | -2.31 m | -2.85 m | +0.06 m | 2 |
| West Godavari | 17 | -0.89 m | -0.8 m | -0.02 m | 0 |
A positive depth change means the water table fell between May and Sep 2026. These district medians summarise retained source-series comparisons; they are not area-weighted recharge estimates. Historical-baseline approval remains pending.
| Mandal | District | Aquifer | This season | Typical | Shortfall | Storage proxy | Recorded depth |
|---|---|---|---|---|---|---|---|
| Nandyal_Ruralsevere | Nandyal | hard rock | +7.39 m | -0.66 m | +8.05 m | 34 Mm³ | 10.9 m bgl |
| Rentachintalasevere | Palnadu | alluvial | +4.7 m | -0.49 m | +5.19 m | 18.7 Mm³ | 8.55 m bgl |
| Somalasevere | Annamayya | hard rock | +8.73 m | -1.65 m | +10.38 m | 110.9 Mm³ | 16.12 m bgl |
| Kalikirisevere | Annamayya | hard rock | +8.04 m | -1.02 m | +9.06 m | 30.7 Mm³ | 25.23 m bgl |
| Chatraisevere | Eluru | alluvial | +7.82 m | -10.07 m | +17.89 m | 136.5 Mm³ | 17.74 m bgl |
| Gannavaramsevere | Krishna | alluvial | +0.13 m | -5.19 m | +5.32 m | 96.9 Mm³ | 7.64 m bgl |
| Prathipadu (east Godavari)severe | Kakinada | coastal | +0.04 m | -8.43 m | +8.47 m | — | 7.96 m bgl |
| Challapallesevere | Krishna | alluvial | -0.53 m | -3.42 m | +2.88 m | 37.7 Mm³ | 4.21 m bgl |
| Pedapadusevere | Eluru | alluvial | +4.83 m | -5.21 m | +10.04 m | 197.1 Mm³ | 25.11 m bgl |
| Orvakalsevere | Kurnool | hard rock | +14.61 m | -2.36 m | +16.98 m | 116.2 Mm³ | 29.68 m bgl |
| Kudairsevere | Ananthapuramu | hard rock | +2.56 m | -0.09 m | +2.65 m | 23.9 Mm³ | 13.11 m bgl |
| Burjasevere | Srikakulam | coastal | -0.08 m | -2.58 m | +2.5 m | 7.1 Mm³ | 4.73 m bgl |
| Veerullapadusevere | NTR | alluvial | -0.77 m | -3.73 m | +2.96 m | 13.7 Mm³ | 3.65 m bgl |
| Etcherlasevere | Srikakulam | coastal | -0.01 m | -4.63 m | +4.62 m | 18.3 Mm³ | 8.98 m bgl |
| Rudravaramsevere | Nandyal | hard rock | +9.89 m | -9.26 m | +19.14 m | 202.4 Mm³ | 14.78 m bgl |
| Ravikamathamsevere | Anakapalli | coastal | +1.74 m | -3.91 m | +5.65 m | 29.1 Mm³ | 8.73 m bgl |
| Durgisevere | Palnadu | alluvial | +1.26 m | -9.96 m | +11.23 m | 87.6 Mm³ | 15.85 m bgl |
| Lakkavarapukotasevere | Vizianagaram | coastal | -0.69 m | -4.48 m | +3.79 m | 9.7 Mm³ | 4.99 m bgl |
| Kotabommalsevere | Srikakulam | coastal | -1.82 m | -5.05 m | +3.22 m | 40.5 Mm³ | 8.09 m bgl |
| Gudivadasevere | Krishna | alluvial | +0.63 m | -1.56 m | +2.19 m | 30.6 Mm³ | 5.14 m bgl |
| Nandigamasevere | NTR | alluvial | -0.23 m | -4.05 m | +3.82 m | 14.2 Mm³ | 4.95 m bgl |
| Hukumpetasevere | Alluri Sitharama Raju | coastal | -0.72 m | -2.89 m | +2.17 m | 20.2 Mm³ | 2.59 m bgl |
| Ghantasalasevere | Krishna | alluvial | +1.58 m | -0.86 m | +2.44 m | 27 Mm³ | 12.2 m bgl |
| Rajavommangisevere | Polavaram | coastal | -0.33 m | -3.24 m | +2.91 m | 36.4 Mm³ | 4.58 m bgl |
| Ibrahimpatnamsevere | NTR | alluvial | -0.58 m | -2.69 m | +2.11 m | 11.5 Mm³ | 3.98 m bgl |
A mandal is flagged only when it misses its own normal by at least 1 m and by at least twice its own year-to-year spread. Either test alone fails: metres alone flag every naturally swinging hard-rock mandal, and spread alone flags a delta mandal that moved twenty centimetres more than usual. How this is built.