AP Water Intelligence
Data sources and the groundwater model
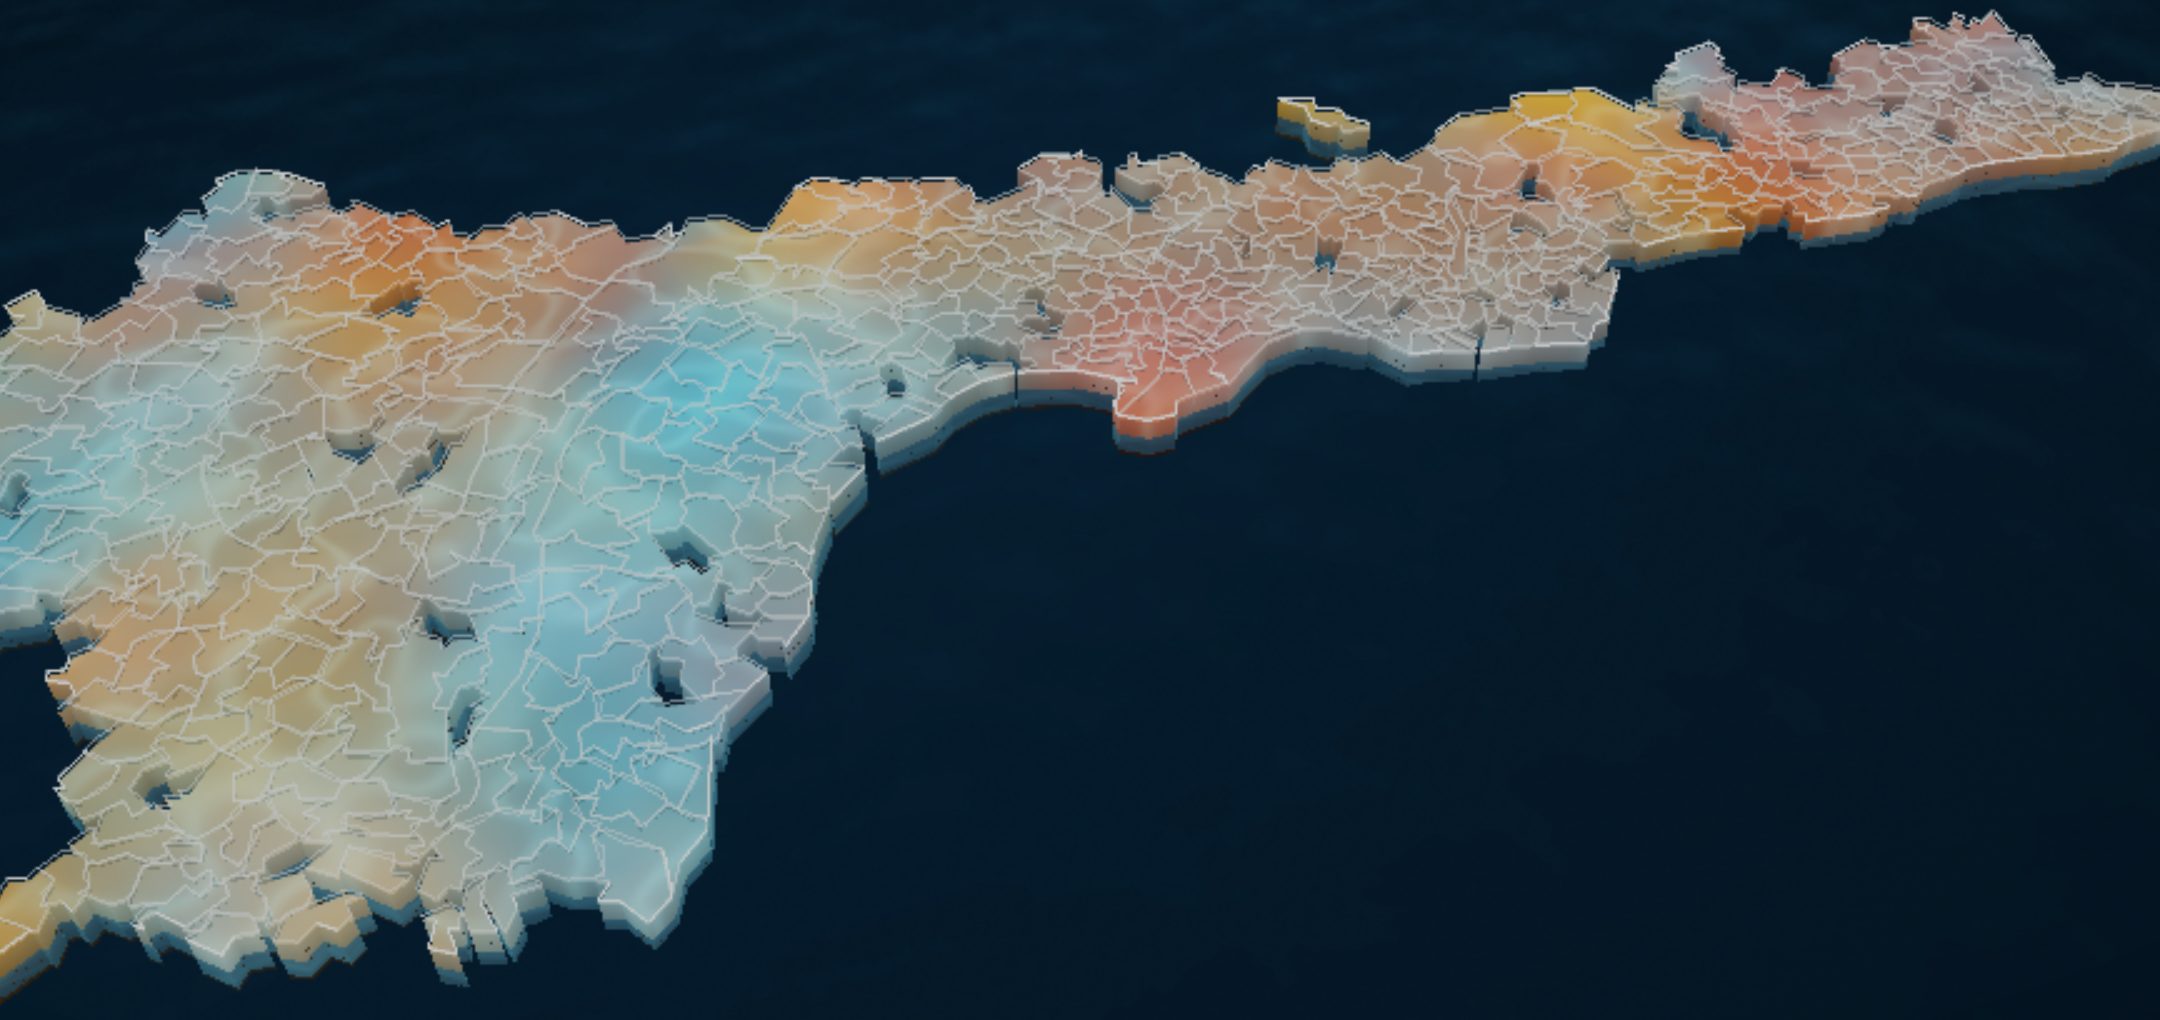
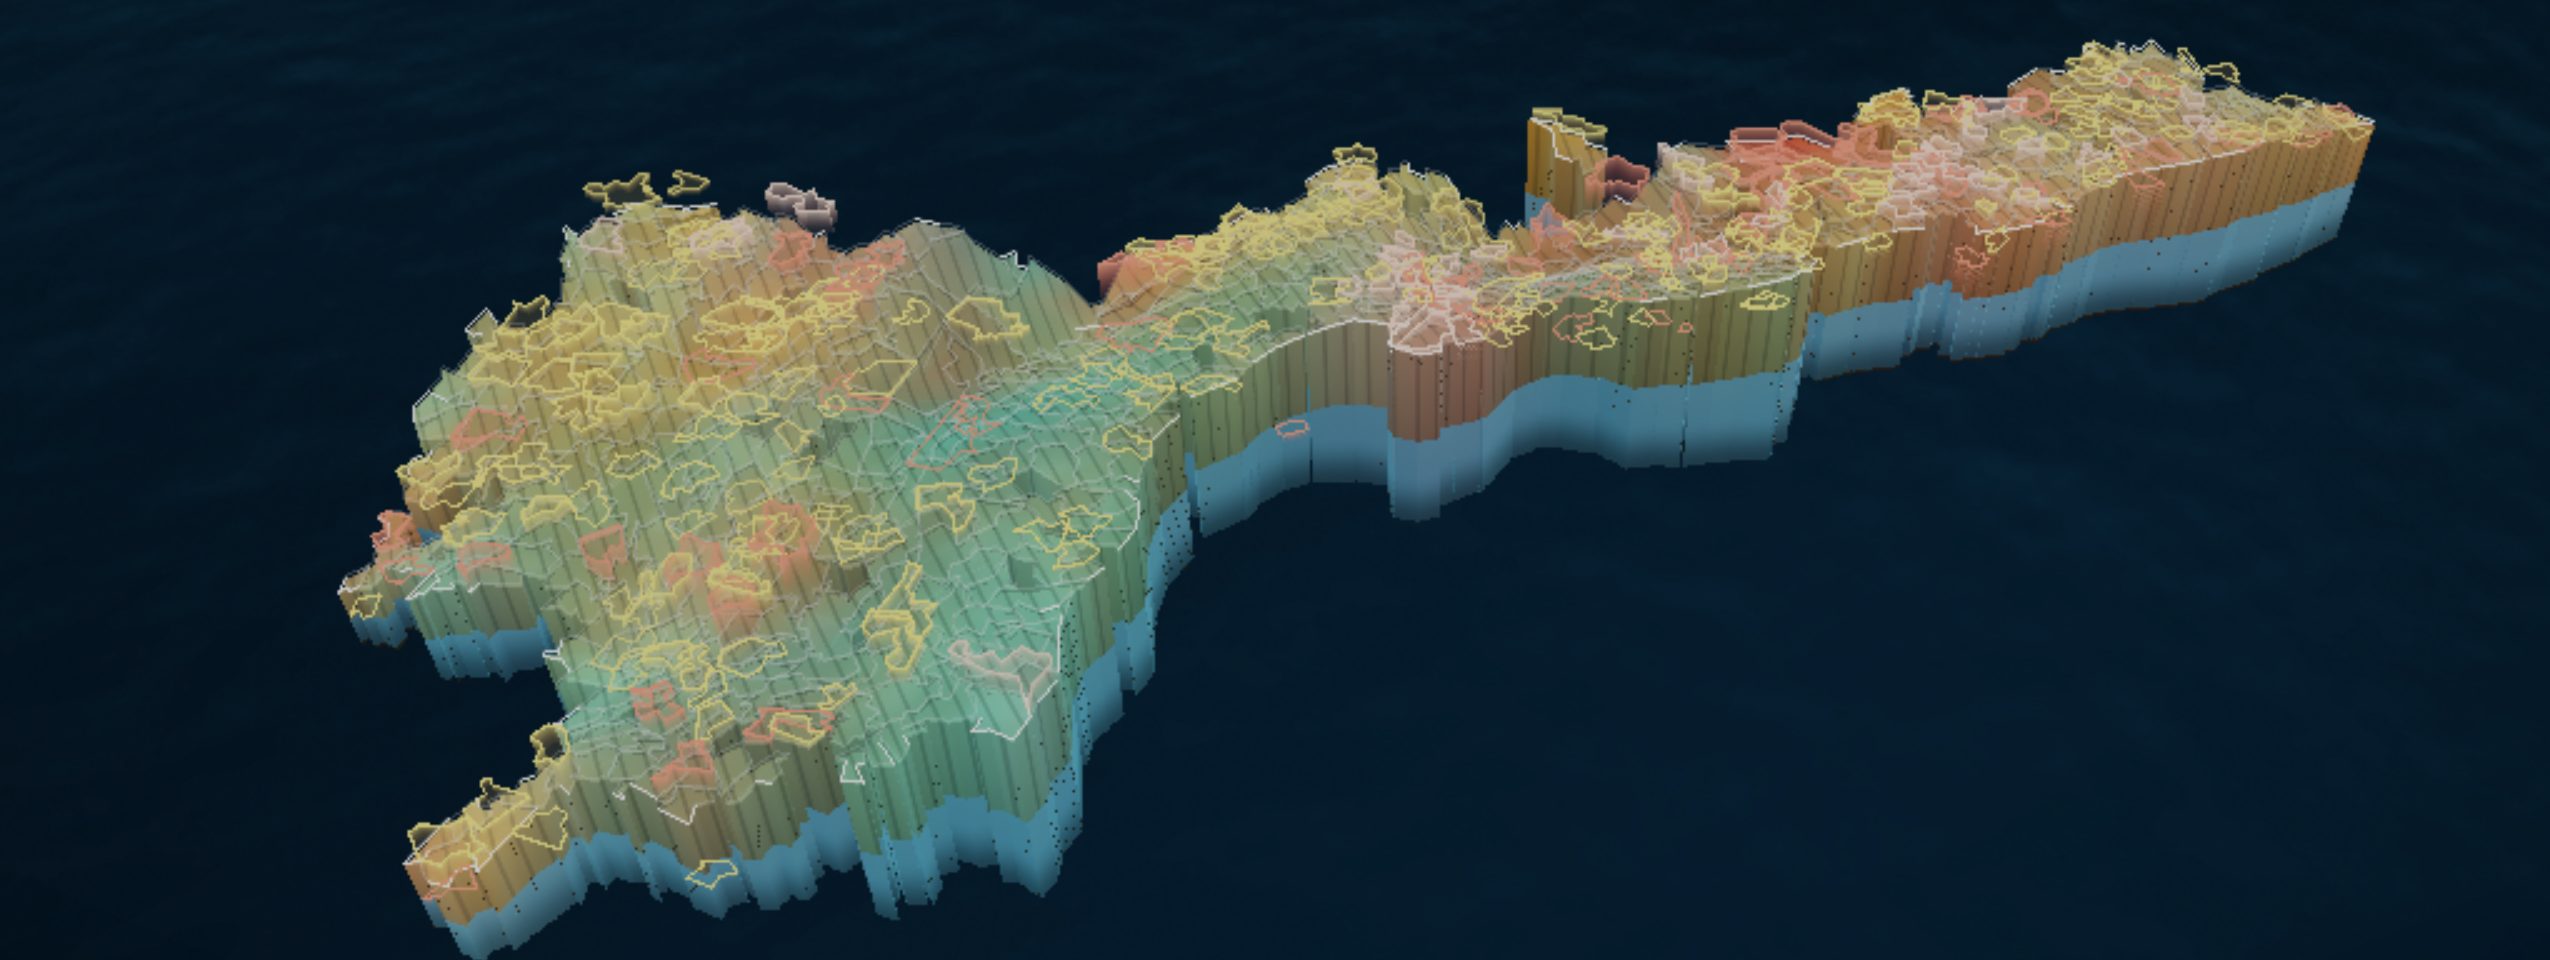
Depth to water in September, each mandal against its own usual September, as the platform’s 3D view draws it: blue shallower than usual, slate about usual, amber deeper, red deeper than any September on record.
Every mandal's water, checked weekly
A working prototype for the Chief Minister’s office and district officers. Every Monday it reports where groundwater, rain, soil moisture and crops stand in each of Andhra Pradesh’s 670 mandals, and what is likely next.
The question is local: is this mandal’s water table where it usually is for this month, is it heading somewhere it has not been, and do rain, soil and crops agree? Three rules run through the whole platform.
Measured and modelled stay apart
A piezometer reading is never shown as an estimate, nor an estimate as a reading. Every figure carries its source and date.
Each place against its own past
Depth swings with the season and the aquifer, so a mandal is compared with its own readings for the same month, never a statewide threshold.
Open inputs, tested weekly
Every input is open or public. A scheduled job re-fetches, rebuilds, tests and republishes the site each week.
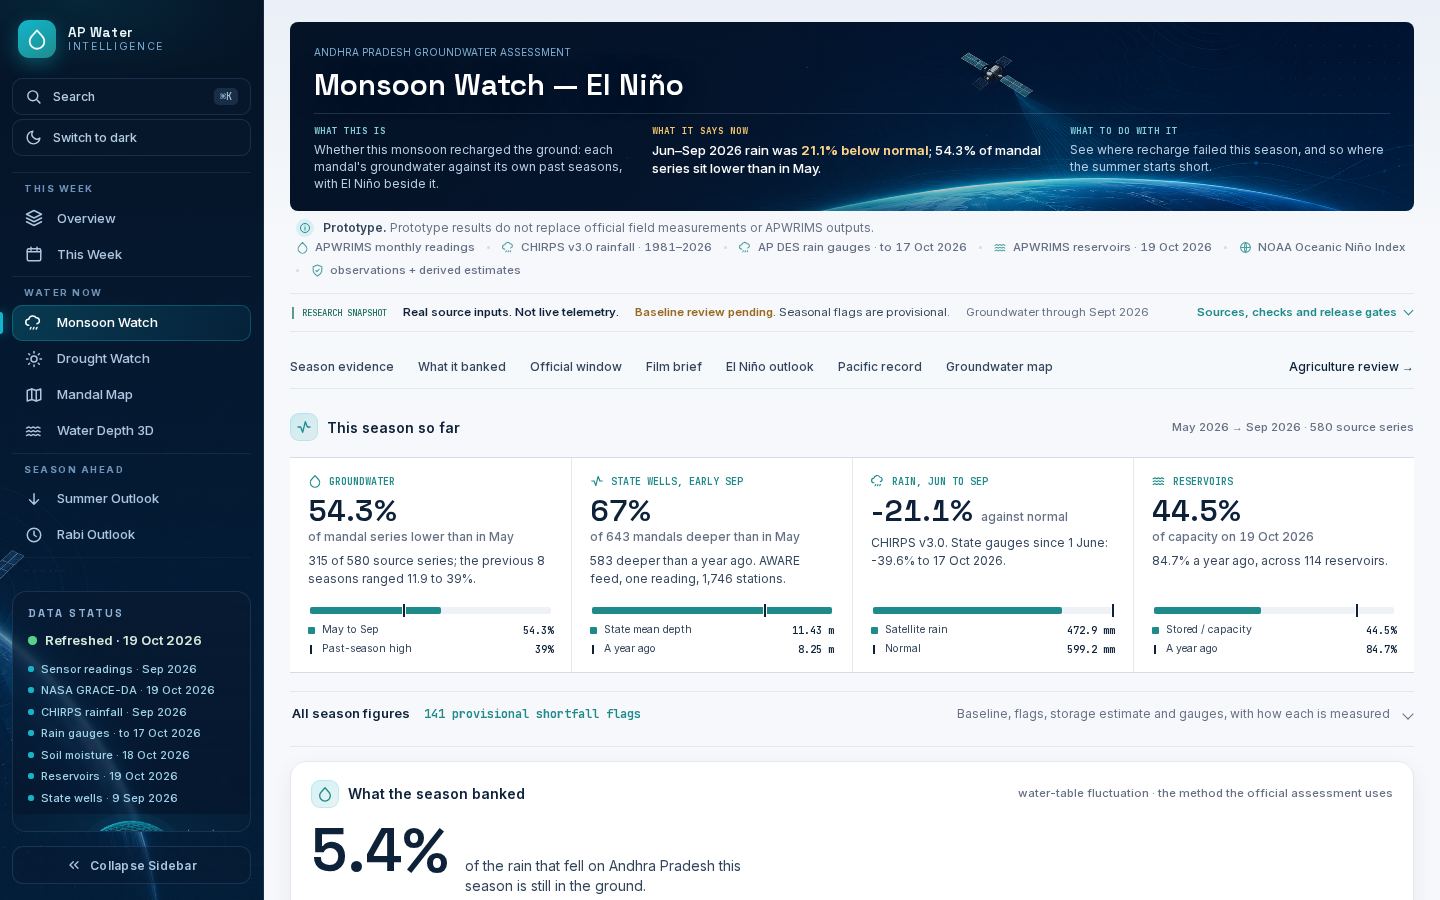
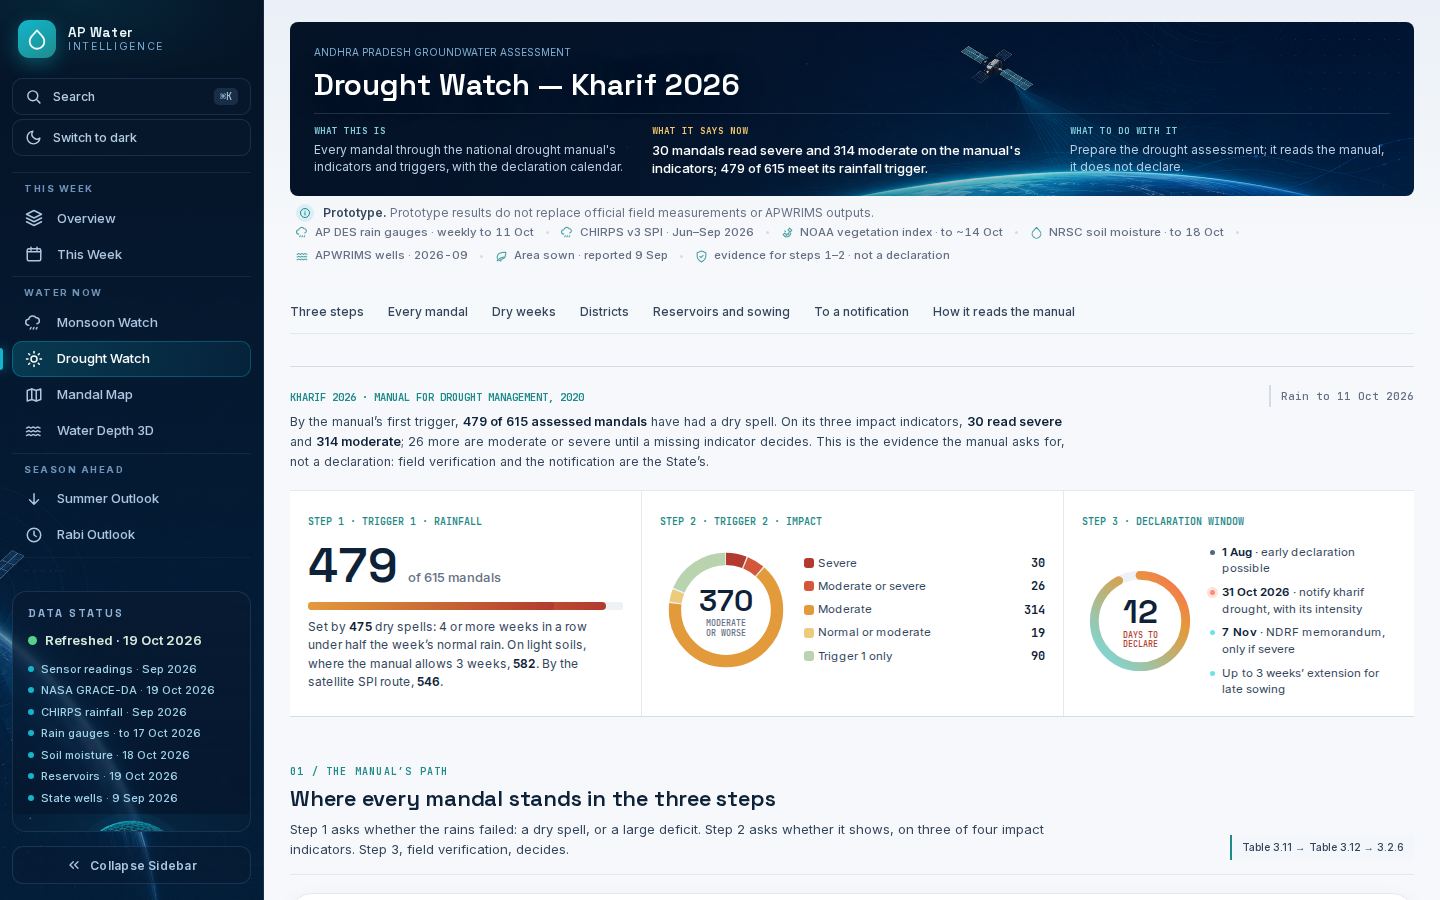
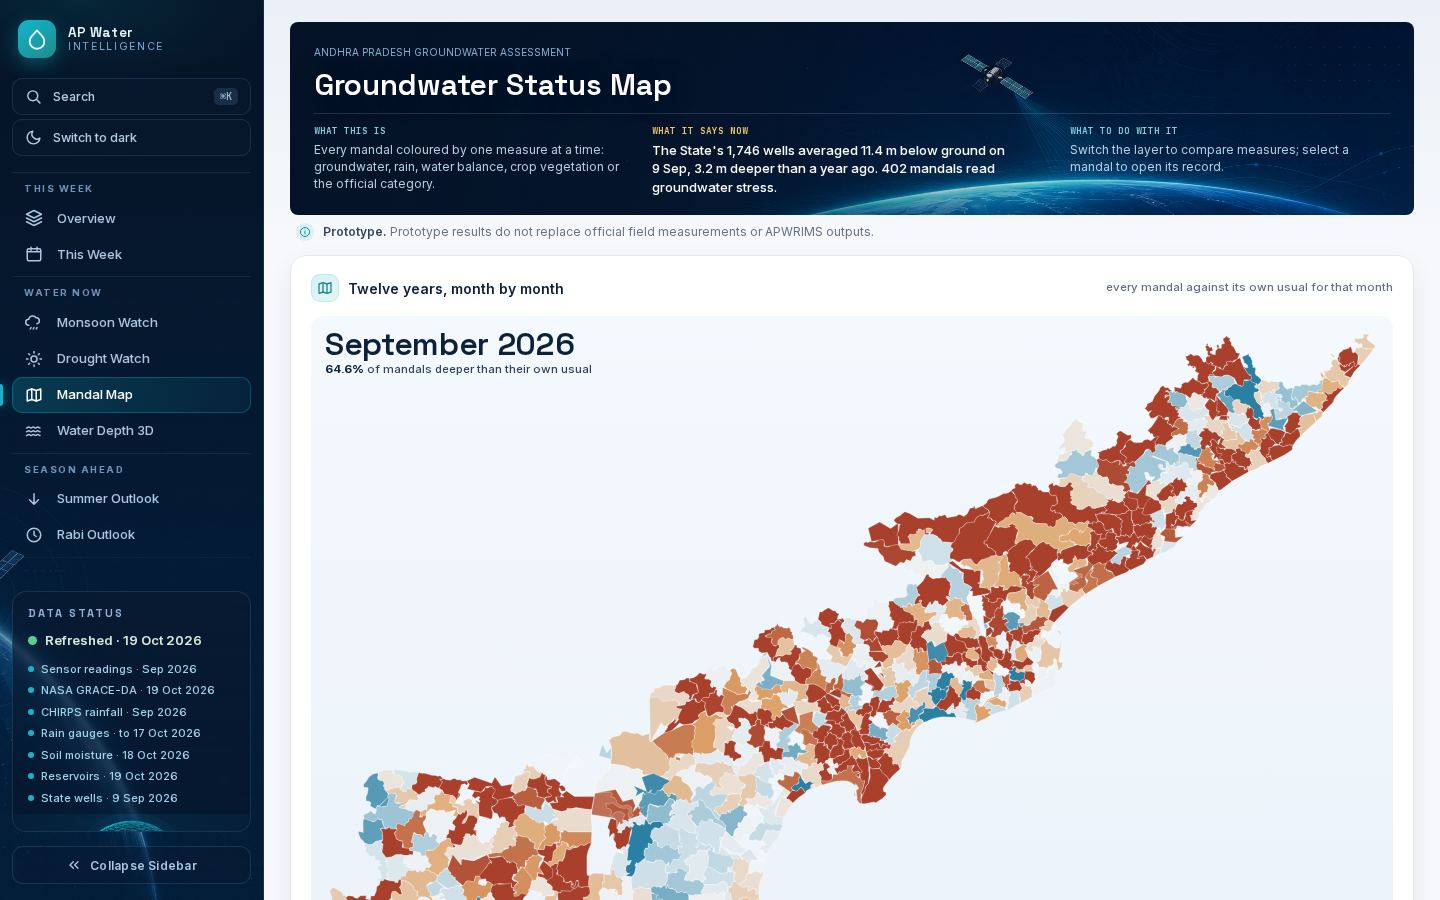
Measured readings pass straight through to the pages. Only the model’s estimates and the rule-based calls are derived, and each says so. The site’s screens: a weekly overview, Monsoon Watch, Drought Watch, a mandal map, the 3D depth view, Summer and Rabi outlooks, a crop water check, and briefs by district and assembly constituency; a one-page digest is printed each week.
One measured series, twenty supporting ones
Only the first row is what the model predicts; the rest are inputs, cross-checks or context, each joined to the same 670 mandal outlines before use.
Water
the measured target and official context| Source | What it gives | Resolution · cadence | Used for |
|---|---|---|---|
| APWRIMSAP Water Resources Information & Management System | Depth to water below ground per mandal, from state piezometers, 2014 to date | mandal · monthly | The measured series the model learns from and every page reports |
| APWRIMS context feedsAP DES gauges · NRSC soil moisture · reservoirs | Mandal rain gauges, modelled soil moisture, reservoir storage and canal releases | mandal · daily to weekly | Drought triggers, the crop check, reservoir context |
| CGWB assessment via INGREShosted by IIT Hyderabad | 2024 Dynamic Ground Water Resource Assessment: stage of extraction and category | unit · annual | The official safe → over-exploited label |
| CGWB station levelsvia India Data Portal | Central network well readings, 2013 to 2023 | station · seasonal | Checks the forecast on wells it never saw |
| Jal Jeevan Mission IMISDept. of Drinking Water and Sanitation | Drinking-water schemes by source; sources tested | block · weekly | Who drinks from wells past their record |
| NASA GRACE-DAGRACE gravimetry assimilated in a land model | Groundwater storage percentile | coarse grid · weekly | Regional storage context only |
| AP Data LakeAI Living Labs, access-controlled | The State's official groundwater snapshot and mandal outlines | mandal · on request | Official boundaries; well-count check |
Rain and climate
model inputs and climate context| Source | What it gives | Resolution · cadence | Used for |
|---|---|---|---|
| CHIRPS v3.0UC Santa Barbara Climate Hazards Center | Satellite-and-gauge rainfall, 1981 to date | 0.05° · monthly | The model’s rainfall input, anomalies, SPI |
| IMD gridded rainfallIndia Meteorological Department | Observed rainfall (Pai et al. 2014) | 0.25° · yearly release | Cross-check of CHIRPS; not the input |
| NASA POWERMERRA-2 reanalysis | Rainfall | ≈55 km · monthly | Fallback where CHIRPS is missing |
| TerraClimateUniversity of Idaho | Actual evapotranspiration, water balance | ≈4 km · monthly | Rain-minus-ET context (not recharge) |
| NOAA CPCOceanic Niño Index, ENSO outlook | El Niño state and official outlook | index · monthly | El Niño context and composites |
| NOAA ERSST v5 · GHCN-CAMSwith NOAAGlobalTemp | Sea-surface and air temperature | 2° / 0.5° · monthly | Pacific panel, temperature record |
| ECMWF open forecastvia Open-Meteo | Reference ET and rain, 7 to 10 days ahead | 0.25° · daily | The weekly crop water check |
Land, crops and people
crop stress, cropland and exposure| Source | What it gives | Resolution · cadence | Used for |
|---|---|---|---|
| NOAA STAR VHPVegetation Health Product | Vegetation Condition Index | 4 km · weekly | Crop stress; the crop check's track record |
| Sentinel-2 L2AESA Copernicus via Element 84, AWS | Reflectance and scene classification | 10 m (read at 80–160 m) · 5 days | Crop check's field-scale score; water in tanks |
| JRC Global Surface WaterEC Joint Research Centre, 1984–2021 | Where water has come and gone | 30 m · static | Tank beds, apart from lakes and aquaculture |
| ESA WorldCereal 2021 | Irrigated versus rainfed cropland | 10 m · one season | Isolating rainfed fields |
| ESA WorldCover 2021 | Land cover and cropland | 10 m · one year | Cropland mask |
| ISRIC SoilGrids | Soil texture and water capacity | 250 m · static | Soil water holding in the crop check |
| WorldPop 2020UN-adjusted | Population | 1 km · one year | People living in mandals at risk |
Rules rather than data: the national Manual for Drought Management 2020 (drought triggers), FAO-56 (crop water use), and CGWB’s convention of comparing pre-monsoon (May) depths year to year.
This month's depth, with an 80% band
Gradient-boosted trees estimate this month’s depth and the depth three months ahead. Retrained before every month, it errs by 0.91 m on average, 13% better than carrying the last reading forward, and its 80% band held 81.1% of readings.
| Test | Months | Model | Baseline | Gain |
|---|---|---|---|---|
| Nowcast, held out (trained to Dec 2023), Jan 2024 to Sep 2026 | 22,448 | 1.02 m | 1.15 m last | 11% |
| Nowcast, retrained every month | 16,328 | 0.91 m | 1.05 m last | 13% |
| Forecast 3 months ahead, rolling origins | 20,958 | 1.90 m | 2.22 m no change | 14% |
| 80% band coverage | 22,448 | 81.1% | 80% nominal | ±1.6 m |
| Rise or fall on CGWB’s wells, never trained on (2018–23) | 1,199 | 75% right | 77% State wells | 89 / 38% |
| IMD rain in place of CHIRPS, retrained every month (2024–25) | 16,351 | 1.04 m | 1.06 m CHIRPS | 2%, a year late |
| Ungauged mandal (whole mandal held out) | 82,332 | 4.9 m | state average | not released |
Error grows with depth; the model wins in every band
Average absolute error on held-out months
Six readings of the same 670 mandals
Each map and figure is drawn from this week's published data. Each compares a mandal with its own history, and each method carries a backtest or a rule from an official manual.
September against its usual September
Against the median of the same mandal’s earlier Septembers; within 1 m is usual.
Did this monsoon recharge the ground?
May-to-now against the same mandal’s median over ten seasons; flagged at 1 m short and twice its own spread. Rain 21.1% below normal.
What the national drought manual says
Rain deficit and dry spells under the Manual for Drought Management 2020, then impact on vegetation, soil, groundwater and reservoirs. It reads the manual; it does not declare. 479 meet Trigger 1 on department gauges, 546 on CHIRPS SPI.
Where May 2027 may break the record
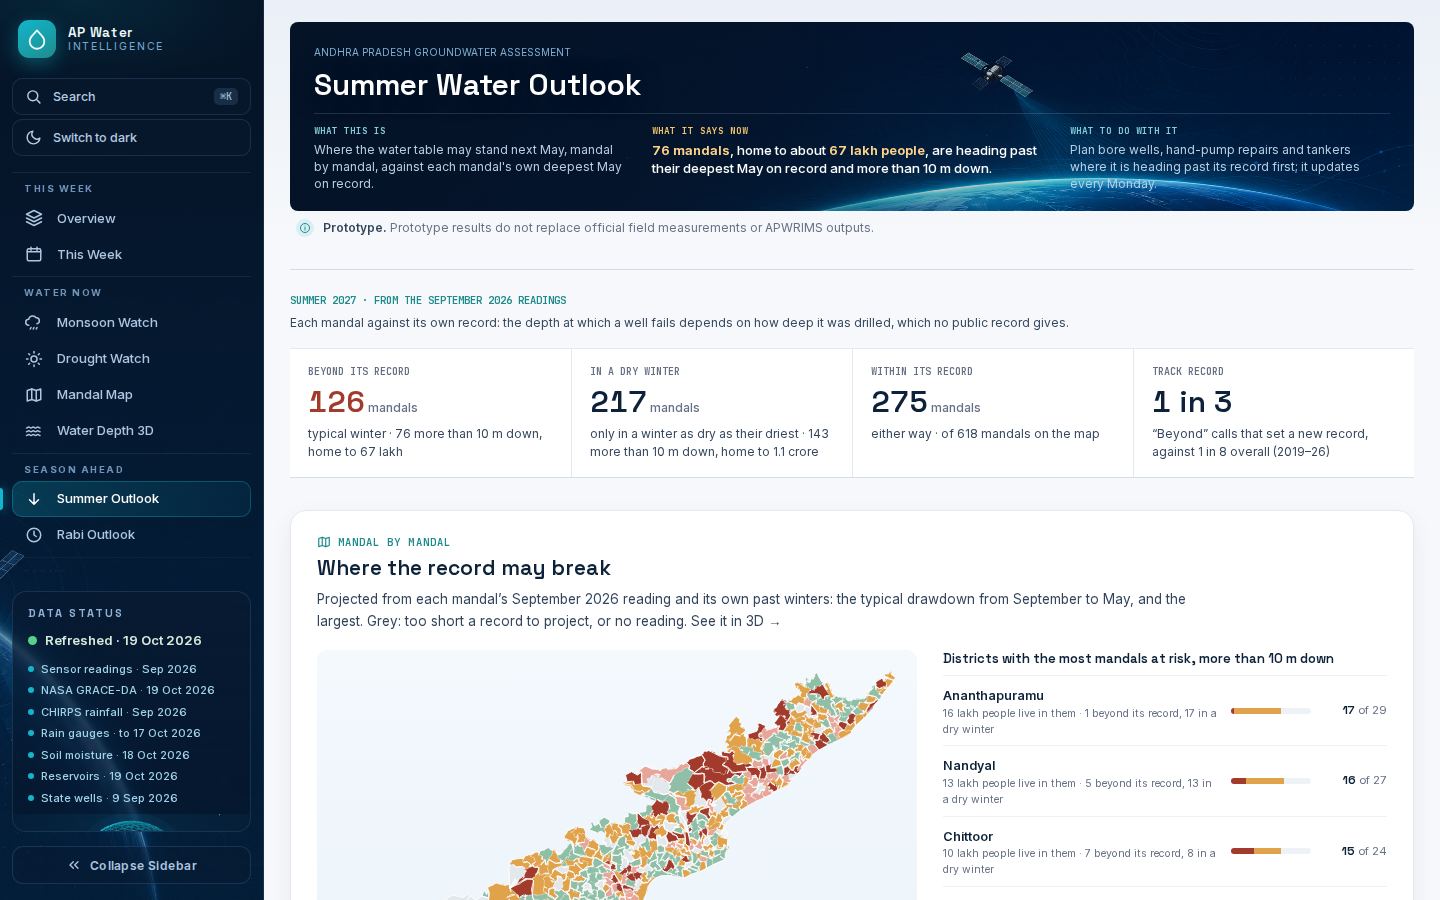
Latest reading plus the mandal’s own past winter drawdowns, against its deepest May. Backtest: past “beyond” calls came true 1 in 3, against 1 in 8 overall.
1,24,219 sources sit in the 126 mandals heading past their deepest May; 11,337 tested above a chemical limit.
143 of 318 tank mandals emptier than usual; the typical tank bed is 26% wet, the lowest of 8 years.
What the season has done to the crop
Groundwater matters here because of what grows above it. 437 of 670 mandals are mostly rainfed, and across the State under a quarter of mapped cropland is irrigated — so for most of Andhra Pradesh the monsoon is the irrigation.
How the crop has read these four weeks
Vegetation Condition Index against each cell’s own record, weighted by cropland share, averaged over the four weeks to 14 October 2026. Table 3.4 of the drought manual: 60–100 normal, 40–60 moderate, under 40 severe.
What the annual balance says
The 2025–26 Dynamic Ground Water Resources assessment, GEC-2015: a year’s recharge against a year’s draft. It is not a reading of this week, and the two maps are not in competition.
Each week the check compares a mandal’s rain and reference evapotranspiration, from the ECMWF open forecast, with what its crop would need. Every call is frozen the day it is made and scored three weeks later against the vegetation that followed — Sentinel-2 NDVI over rainfed cropland at 160 m, and the vegetation index. 5 weeks are on the record, none scored yet; the first verdict falls due on 31 October 2026.
Where a hydrogeologist's view would help most
The model knows depth well and storage, aquifers and pumping poorly. These are the questions we would most value a review on.
Six inputs, and the number each one moves
In an ordinary season the forecast is already at the practical ceiling for any method. Almost all of the headroom that remains sits in seasons that break the pattern — when the water table is set by what is pumped rather than by what fell, and pumping is the one driver the model cannot see.